Democratic Party: vote totals & records
Democratic Party’s biggest vote-getters
Each figure is that person’s career popular votes on the Democratic line, the same way their own profile counts (a presidential ticket’s votes count for both names on it). For someone who also ran under another party, it is less than the all-party career total shown on their profile.
| # | Politician | Votes on the Democratic line |
|---|---|---|
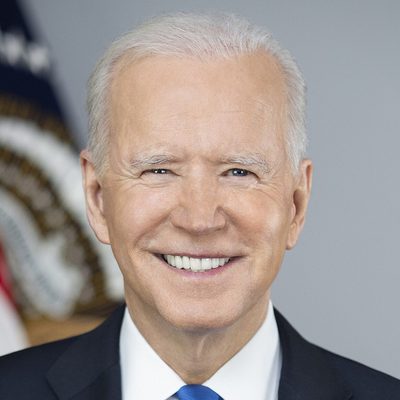
| 1 | Joe BidenD Delaware | 216,697,8123 races |
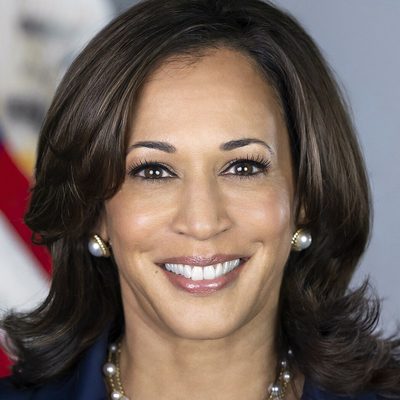
| 2 | Kamala HarrisD | 156,301,1142 races |
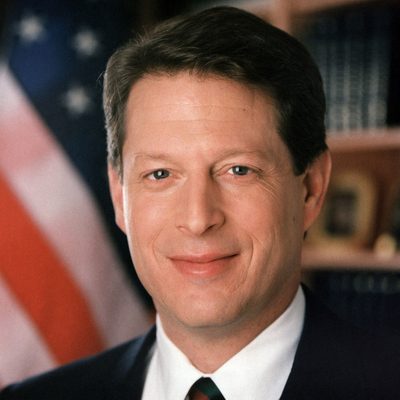
| 3 | Al GoreD Tennessee | 143,310,8883 races |
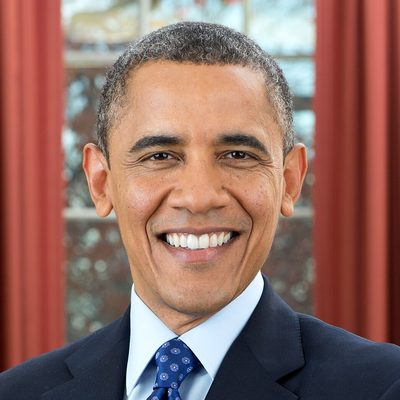
| 4 | Barack ObamaD Illinois | 135,414,3112 races |
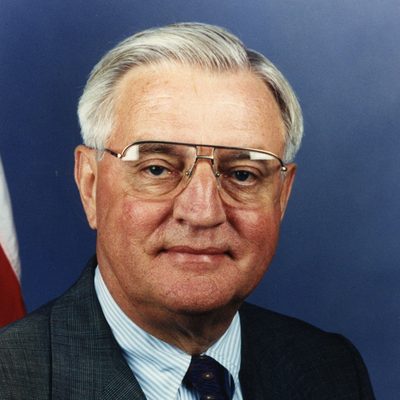
| 5 | Walter MondaleD Minnesota | 113,889,3483 races |
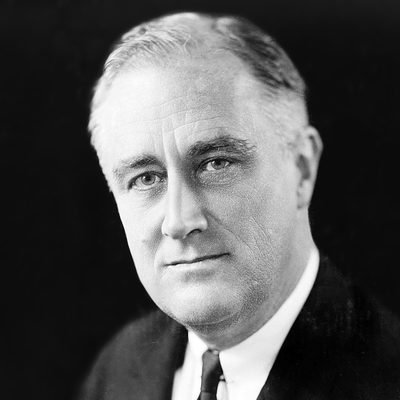
| 6 | Franklin D. RooseveltD New York | 112,561,3405 races |
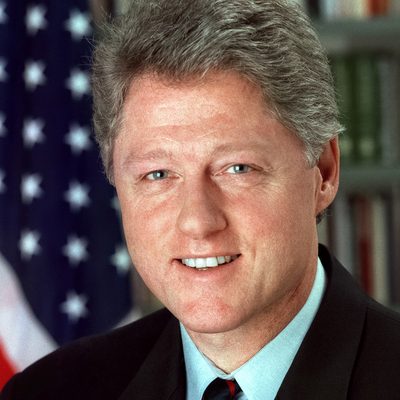
| 7 | Bill ClintonD Arkansas | 92,310,9912 races |
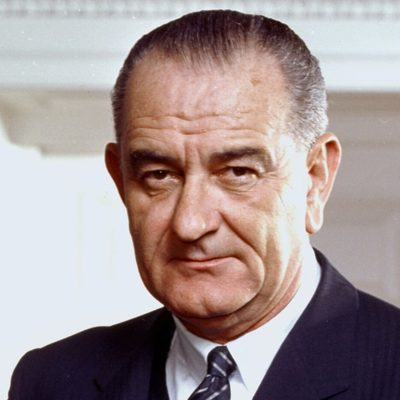
| 8 | Lyndon B. JohnsonD Texas | 77,356,1362 races |
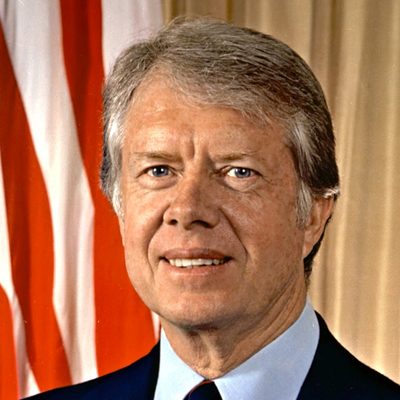
| 9 | Jimmy CarterD Georgia | 76,311,9962 races |
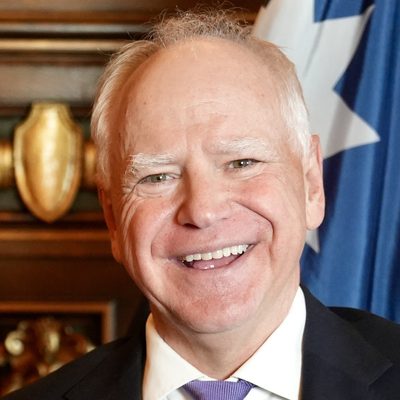
| 10 | Tim WalzD Minnesota | 75,017,6131 race |
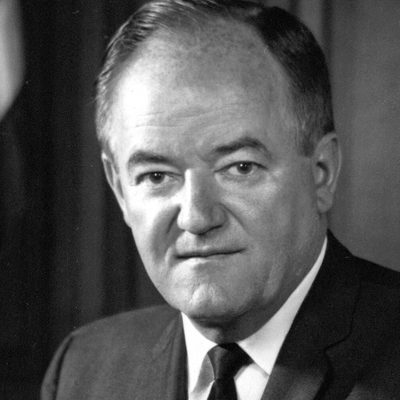
| 11 | Hubert HumphreyD Minnesota | 74,027,0952 races |
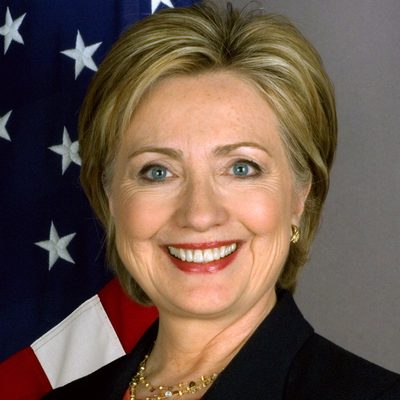
| 12 | Hillary ClintonD New York | 65,853,5141 race |
| 13 | Tim KaineD Virginia | 65,853,5141 race |
| 14 | John KerryD Massachusetts | 59,028,4441 race |
| 15 | John EdwardsD North Carolina | 59,028,4441 race |
| 16 | Adlai StevensonD Illinois | 53,113,8552 races |
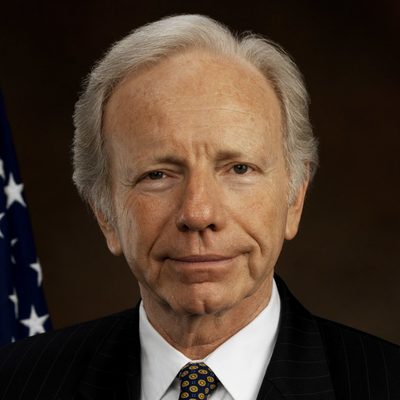
| 17 | Joe LiebermanD Connecticut | 50,999,8971 race |
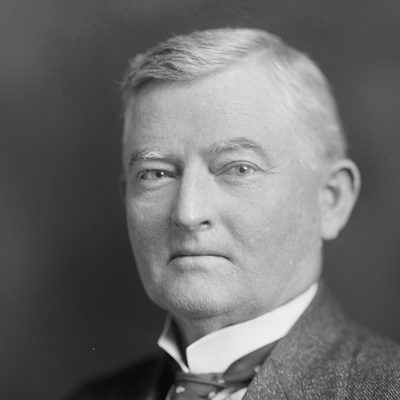
| 18 | John Nance GarnerD | 50,574,5052 races |
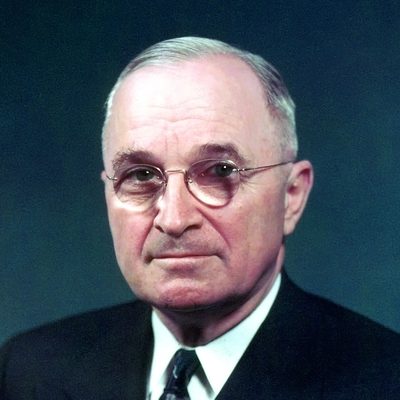
| 19 | Harry S. TrumanD Missouri | 49,708,2002 races |
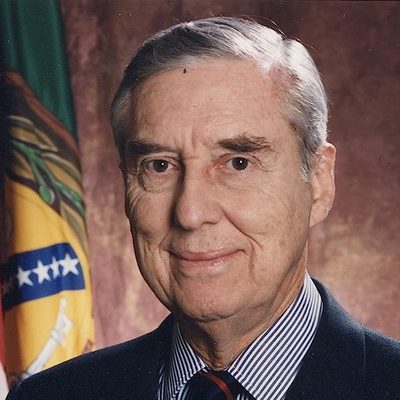
| 20 | Lloyd BentsenD Texas | 41,809,4761 race |
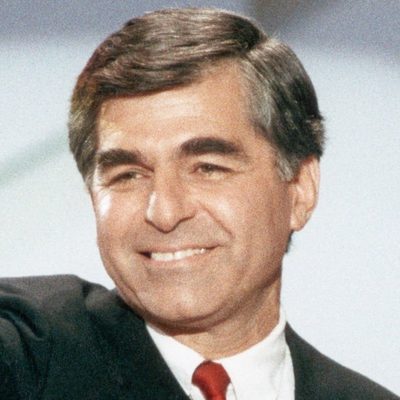
| 21 | Michael DukakisD Massachusetts | 41,809,4761 race |
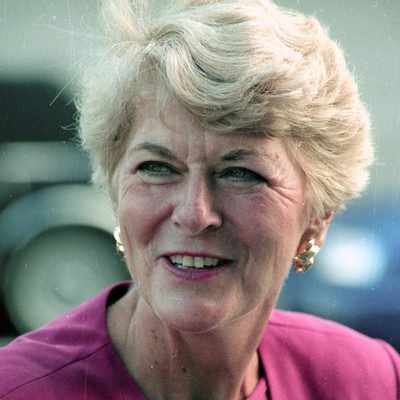
| 22 | Geraldine FerraroD New York | 37,577,3521 race |
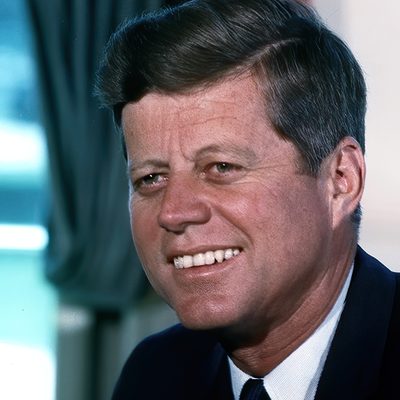
| 23 | John F. KennedyD Massachusetts | 34,227,0961 race |
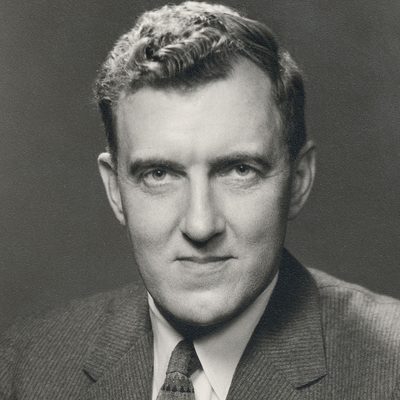
| 24 | Edmund MuskieD Maine | 30,898,0551 race |
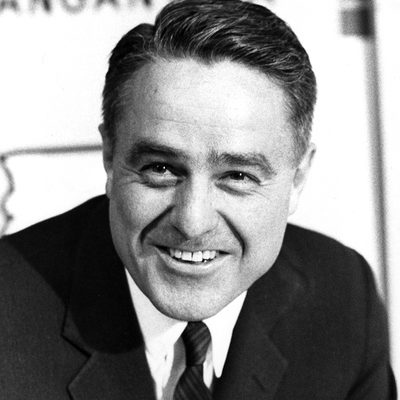
| 25 | Sargent ShriverD Maryland | 29,173,2221 race |
| # | Politician | Votes on the Democratic line |
|---|---|---|
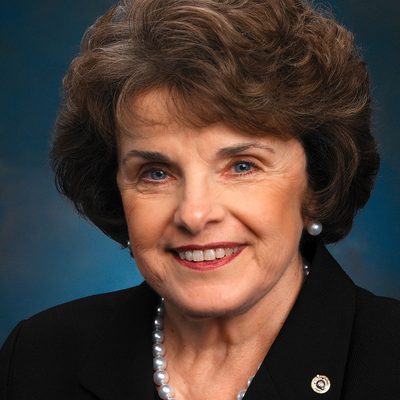
| 1 | Dianne FeinsteinD California | 32,397,2066 races |
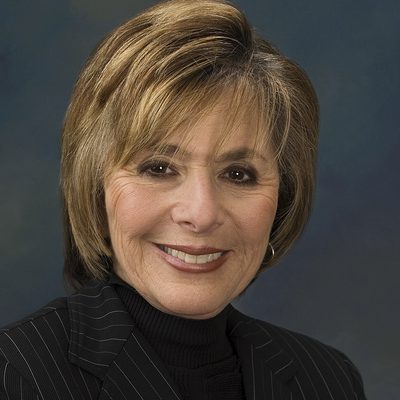
| 2 | Barbara BoxerD California | 22,473,4799 races |
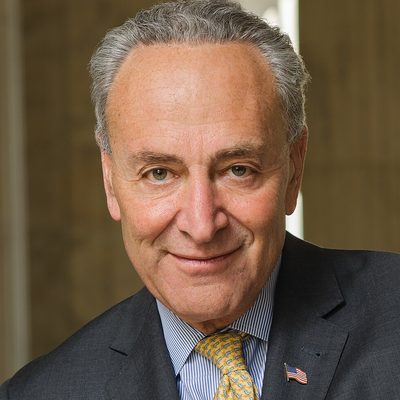
| 3 | Charles E. SchumerD New York | 19,570,63912 races |
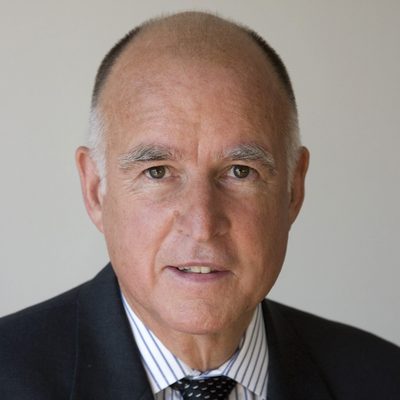
| 4 | Jerry BrownD California | 16,826,9774 races |
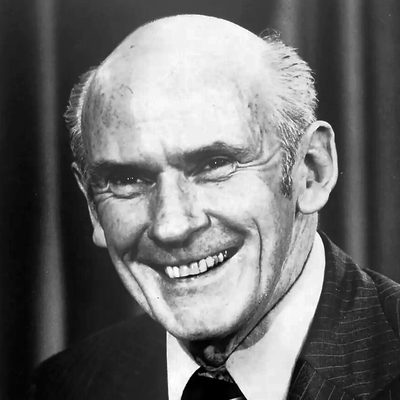
| 5 | Alan CranstonD California | 15,724,2824 races |
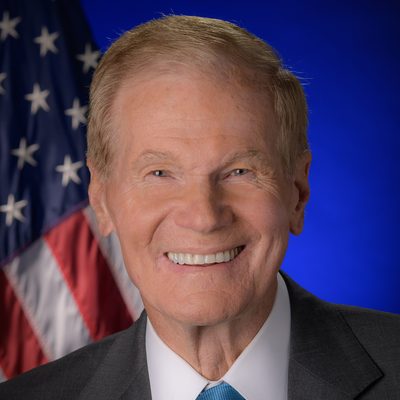
| 6 | Bill NelsonD Florida | 15,286,97810 races |
| 7 | Richard J. DurbinD Illinois | 14,230,96912 races |
| 8 | Gavin NewsomD California | 14,191,5142 races |
| 9 | Kirsten E. GillibrandD New York | 13,896,2975 races |
| 10 | Robert F. WagnerD New York | 12,911,1325 races |
| 11 | Matthew MerrittD New York | 12,410,7715 races |
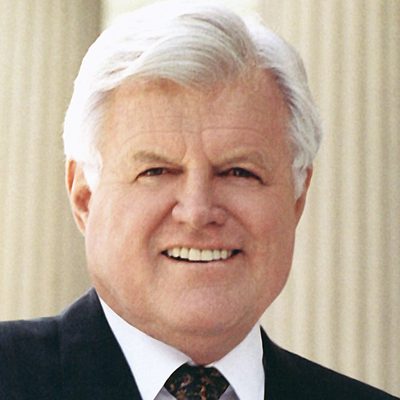
| 12 | Edward M. KennedyD Massachusetts | 12,243,0778 races |
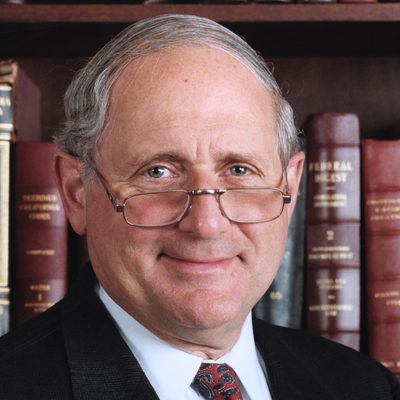
| 13 | Carl LevinD Michigan | 12,002,5156 races |
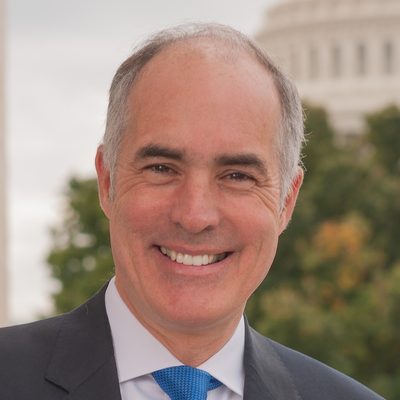
| 14 | Robert P. Casey Jr.D Pennsylvania | 11,576,2084 races |
| 15 | Sherrod BrownD Ohio | 11,013,65011 races |
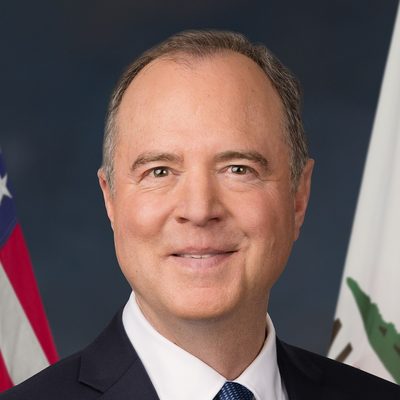
| 16 | Adam B. SchiffD California | 10,783,86713 races |
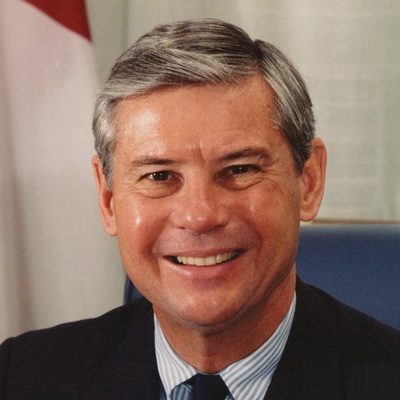
| 17 | Bob GrahamD Florida | 10,705,6485 races |
| 18 | Caroline Mrs OdayD New York | 10,533,2094 races |
| 19 | Herbert H. LehmanD New York | 10,223,1094 races |
| 20 | Mario CuomoD New York | 9,972,2494 races |
| 21 | Debbie StabenowD Michigan | 9,429,7896 races |
| 22 | Frank LauscheD Ohio | 9,292,2026 races |
| 23 | John GlennD Ohio | 9,095,0834 races |
| 24 | Pat BrownD California | 8,926,3593 races |
| 25 | Patty MurrayD Washington | 8,821,6016 races |




Vote share by office, election to election
Each chart is the Democratic share of the recorded vote for that office, cycle by cycle, on one shared scale (raw totals climb with the population, so share is the comparable measure). Presidential coverage centers on the major and notable candidates, so presidential share tracks the two-party share closely; down-ballot coverage is more complete, and down-ballot cycles swing with which seats and states were on the ballot. The House and governor charts begin in 1900, where the year-by-year record is dense; every cycle is in the table below.
Compare Democratic with the other parties in the Party Vote Tracker →
Show all cycles as a table (raw votes & share)
The most recent 24 cycles per office; figures are computed across the full span shown in each chart. Presidential rows link to that election’s results.
President 1828–2024
| Election | Democratic votes | Share |
|---|---|---|
| 2024 | 75,017,613 | 48.5% |
| 2020 | 81,283,501 | 51.7% |
| 2016 | 65,853,514 | 48.6% |
| 2012 | 65,915,795 | 51.3% |
| 2008 | 69,498,516 | 53.2% |
| 2004 | 59,028,444 | 48.6% |
| 2000 | 50,999,897 | 48.9% |
| 1996 | 47,401,185 | 50.1% |
| 1992 | 44,909,806 | 43.3% |
| 1988 | 41,809,476 | 46.1% |
| 1984 | 37,577,352 | 40.8% |
| 1980 | 35,480,115 | 41.7% |
| 1976 | 40,831,881 | 51.1% |
| 1972 | 29,173,222 | 38.2% |
| 1968 | 30,898,055 | 42.6% |
| 1964 | 43,129,040 | 61.3% |
| 1960 | 34,227,096 | 50.1% |
| 1956 | 25,738,765 | 42.0% |
| 1952 | 27,375,090 | 44.5% |
| 1948 | 24,105,695 | 51.0% |
| 1944 | 25,602,505 | 53.8% |
| 1940 | 27,243,466 | 55.0% |
| 1936 | 27,752,648 | 62.5% |
| 1932 | 22,821,857 | 59.1% |
U.S. Senate 1914–2024
| Election | Democratic votes | Share |
|---|---|---|
| 2024 | 55,939,471 | 49.3% |
| 2022 | 38,963,762 | 49.1% |
| 2020 | 38,043,746 | 47.0% |
| 2018 | 50,756,385 | 59.0% |
| 2016 | 51,894,128 | 53.8% |
| 2014 | 19,845,407 | 43.3% |
| 2012 | 50,412,895 | 54.2% |
| 2010 | 27,301,118 | 44.1% |
| 2008 | 34,497,531 | 52.1% |
| 2006 | 33,796,595 | 53.9% |
| 2004 | 44,010,807 | 51.1% |
| 2002 | 19,556,286 | 46.2% |
| 2000 | 36,965,770 | 48.1% |
| 1998 | 26,933,450 | 50.1% |
| 1996 | 23,490,651 | 47.9% |
| 1994 | 22,986,604 | 40.5% |
| 1992 | 32,587,522 | 45.9% |
| 1990 | 17,022,005 | 51.5% |
| 1988 | 31,230,608 | 46.3% |
| 1986 | 23,466,402 | 50.3% |
| 1984 | 22,218,744 | 48.9% |
| 1982 | 24,809,780 | 48.1% |
| 1980 | 30,612,805 | 51.8% |
| 1978 | 14,362,403 | 50.6% |
U.S. House 1790–2024
| Election | Democratic votes | Share |
|---|---|---|
| 2024 | 70,584,871 | 47.8% |
| 2022 | 51,099,503 | 47.7% |
| 2020 | 77,542,238 | 50.8% |
| 2018 | 60,507,706 | 53.3% |
| 2016 | 60,533,320 | 47.1% |
| 2014 | 34,976,877 | 44.8% |
| 2012 | 58,182,126 | 48.0% |
| 2010 | 38,907,097 | 45.0% |
| 2008 | 64,446,633 | 53.4% |
| 2006 | 41,159,855 | 51.8% |
| 2004 | 52,402,647 | 47.0% |
| 2002 | 33,426,328 | 45.5% |
| 2000 | 45,754,996 | 47.1% |
| 1998 | 31,168,332 | 47.3% |
| 1996 | 42,321,861 | 48.4% |
| 1994 | 31,699,432 | 45.4% |
| 1992 | 48,573,295 | 50.6% |
| 1990 | 32,021,975 | 52.2% |
| 1988 | 43,504,987 | 53.3% |
| 1986 | 31,697,220 | 53.3% |
| 1984 | 41,938,030 | 50.9% |
| 1982 | 34,536,799 | 54.1% |
| 1980 | 38,556,596 | 49.5% |
| 1978 | 28,801,800 | 52.8% |
Governor 1790–2025
| Election | Democratic votes | Share |
|---|---|---|
| 2025 | 3,873,467 | 57.5% |
| 2024 | 9,242,906 | 47.4% |
| 2023 | 1,361,621 | 46.1% |
| 2022 | 43,342,714 | 49.9% |
| 2021 | 2,938,941 | 50.2% |
| 2020 | 8,901,867 | 44.4% |
| 2019 | 1,898,756 | 50.0% |
| 2018 | 46,301,408 | 51.5% |
| 2017 | 2,612,285 | 55.7% |
| 2016 | 8,303,331 | 48.3% |
| 2015 | 1,308,402 | 46.6% |
| 2014 | 29,719,201 | 47.6% |
| 2013 | 1,879,767 | 43.5% |
| 2012 | 7,968,610 | 49.2% |
| 2011 | 995,787 | 38.6% |
| 2010 | 32,935,445 | 48.6% |
| 2009 | 1,906,681 | 43.5% |
| 2008 | 8,395,637 | 51.3% |
| 2007 | 1,159,148 | 42.5% |
| 2006 | 33,448,302 | 52.7% |
| 2005 | 2,250,493 | 54.3% |
| 2004 | 7,534,041 | 50.3% |
| 2003 | 1,628,304 | 48.3% |
| 2002 | 27,866,101 | 45.8% |
This page compiles the Democratic Party's popular vote from our election database, counted at the level of individual races. We report each office on its own and never combine them into a single all-office total, because the same voter can appear in more than one race in a single year (a presidential year also carries Senate, House, and many governor contests). Figures cover general elections; coverage by office is shown below.
Counts are general elections in our data on the Democratic ballot line, reported separately by office. We never combine offices into one total: a single voter can be counted in more than one race in a year. Year ranges are the earliest and latest such elections we record for each office; the U.S. Senate has no popular vote before 1914 (the 17th Amendment), and early House and governor labels follow the historical source and can predate the party’s modern founding.