Republican Party: vote totals & records
Republican Party’s biggest vote-getters
Each figure is that person’s career popular votes on the Republican line, the same way their own profile counts (a presidential ticket’s votes count for both names on it). For someone who also ran under another party, it is less than the all-party career total shown on their profile.
| # | Politician | Votes on the Republican line |
|---|---|---|
| 1 | Donald TrumpR Florida | 214,511,3833 races |
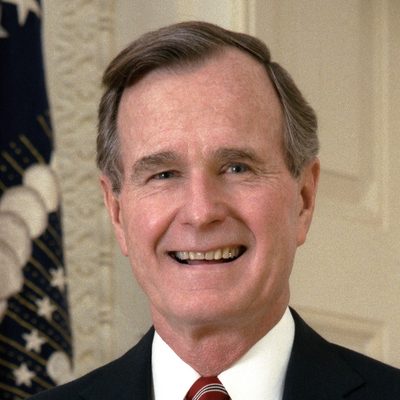
| 2 | George H. W. BushR Texas | 186,349,8494 races |
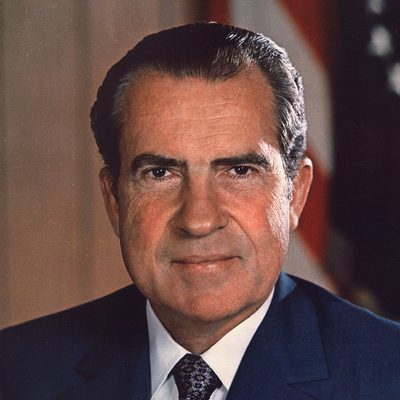
| 3 | Richard NixonR California | 182,643,3585 races |
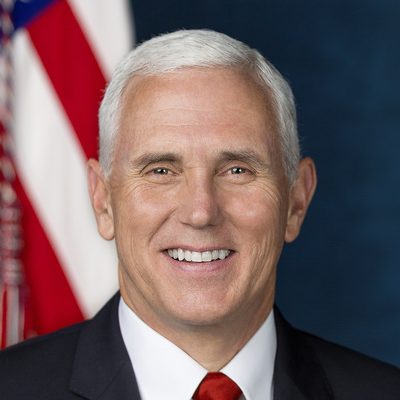
| 4 | Mike PenceR Indiana | 137,208,8032 races |
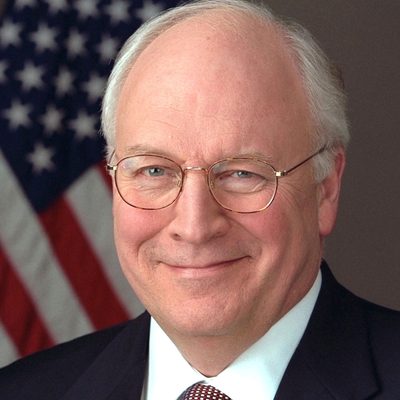
| 5 | Dick CheneyR Wyoming | 112,496,6122 races |
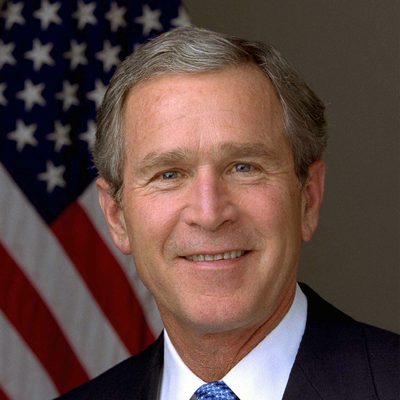
| 6 | George W. BushR Texas | 112,496,6122 races |
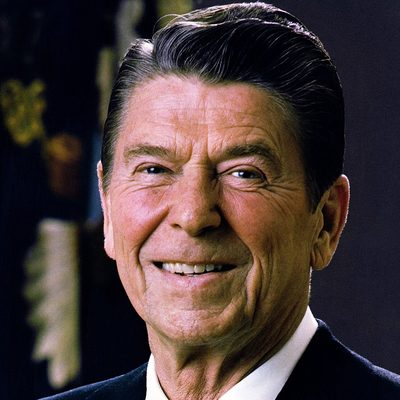
| 7 | Ronald ReaganR California | 98,358,7022 races |
| 8 | Dan QuayleR Indiana | 87,991,1472 races |
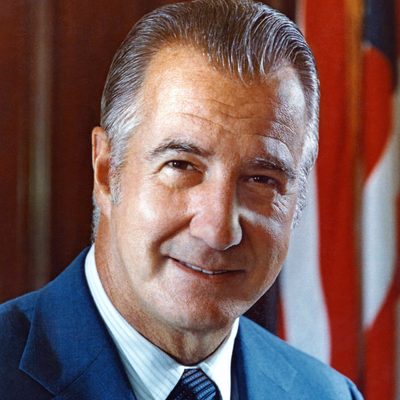
| 9 | Spiro AgnewR Maryland | 78,879,1802 races |
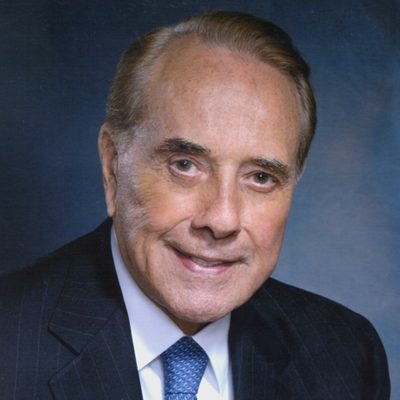
| 10 | Bob DoleR Kansas | 78,346,1032 races |
| 11 | JD VanceR Ohio | 77,302,5801 race |
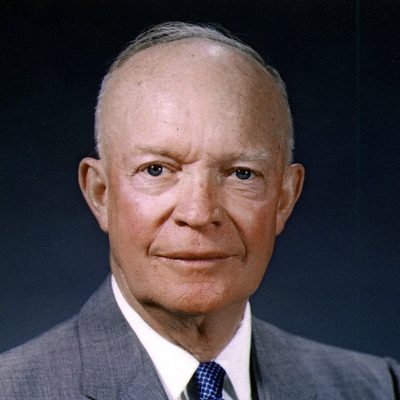
| 12 | Dwight D. EisenhowerR Kansas | 69,656,5322 races |
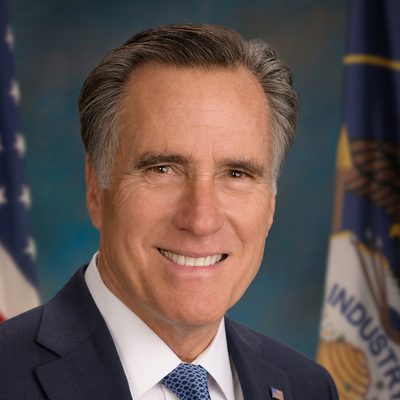
| 13 | Mitt RomneyR Massachusetts | 60,933,5041 race |
| 14 | Paul RyanR Wisconsin | 60,933,5041 race |
| 15 | Sarah PalinR Alaska | 59,948,3231 race |
| 16 | John McCainR Arizona | 59,948,3231 race |
| 17 | Thomas E. DeweyR New York | 43,975,4482 races |
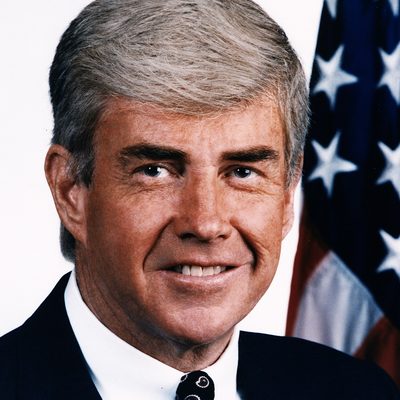
| 18 | Jack KempR | 39,197,4691 race |
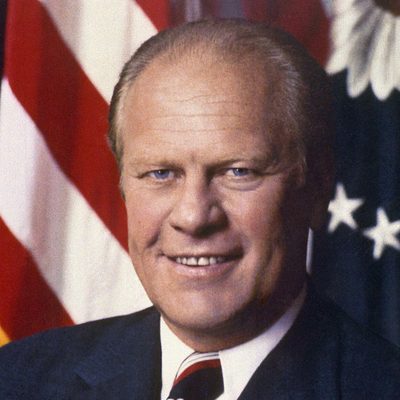
| 19 | Gerald FordR Michigan | 39,148,6341 race |
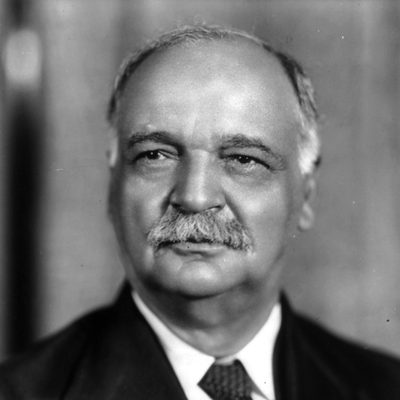
| 20 | Charles CurtisR | 37,154,0312 races |
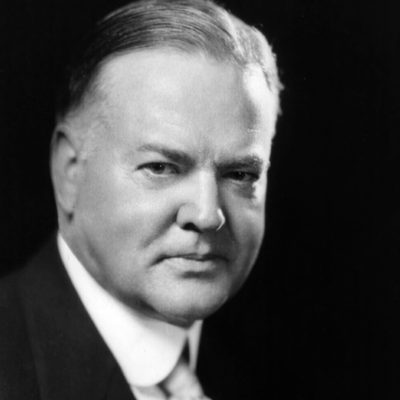
| 21 | Herbert HooverR California | 37,154,0312 races |
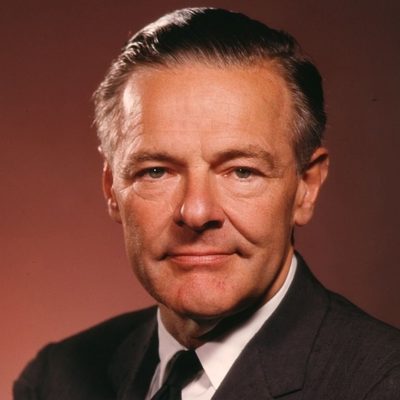
| 22 | Henry Cabot Lodge Jr.R Massachusetts | 34,107,6461 race |
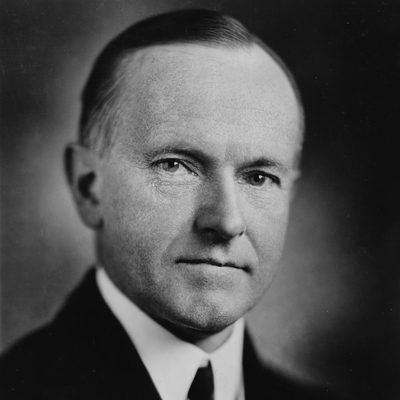
| 23 | Calvin CoolidgeR Massachusetts | 31,872,2652 races |
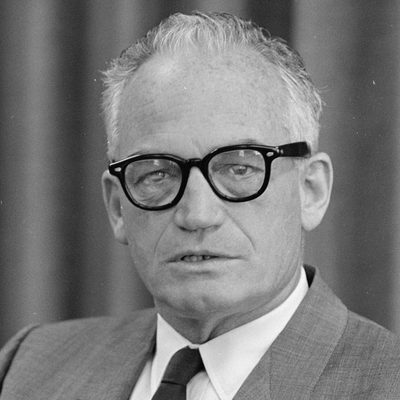
| 24 | Barry GoldwaterR Arizona | 27,175,7541 race |
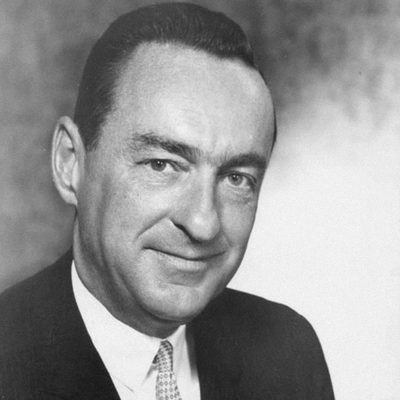
| 25 | William E. MillerR New York | 27,175,7541 race |







| # | Politician | Votes on the Republican line |
|---|---|---|
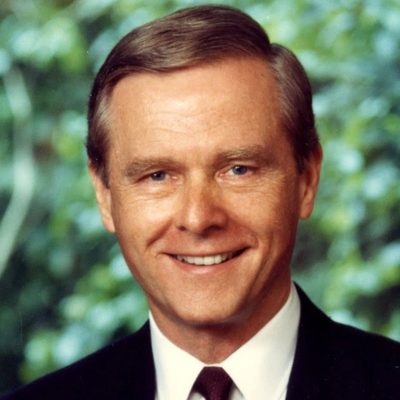
| 1 | Pete WilsonR California | 17,739,6444 races |
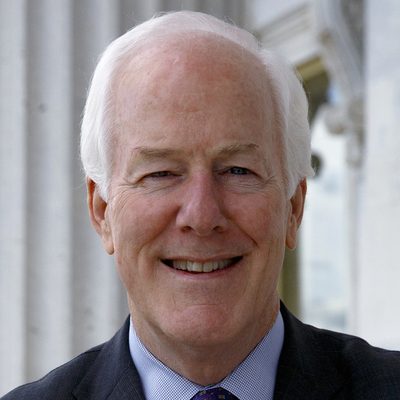
| 2 | John CornynR Texas | 15,658,2264 races |
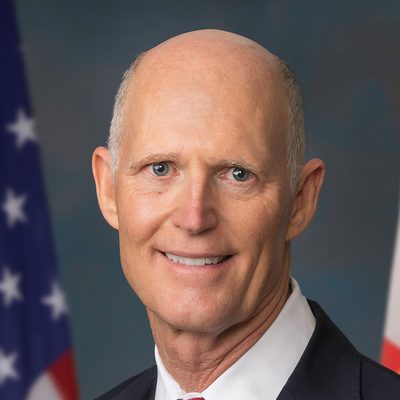
| 3 | Rick ScottR Florida | 15,561,8894 races |
| 4 | Ted CruzR Texas | 14,691,4313 races |
| 5 | Mike DeWineR Ohio | 13,605,21610 races |
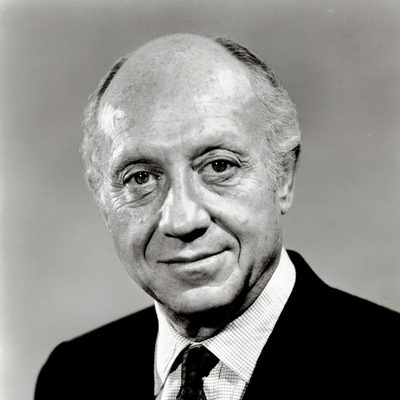
| 6 | Jacob K. JavitsL New York | 12,606,3104 races |
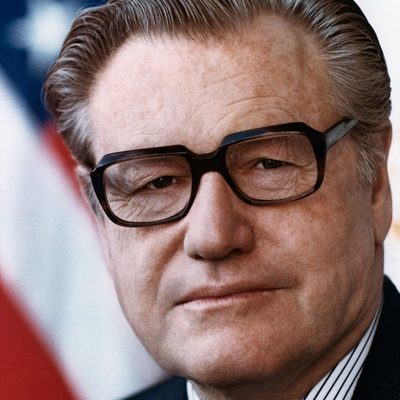
| 7 | Nelson RockefellerR New York | 12,050,5744 races |
| 8 | Marco RubioR Florida | 11,955,7813 races |
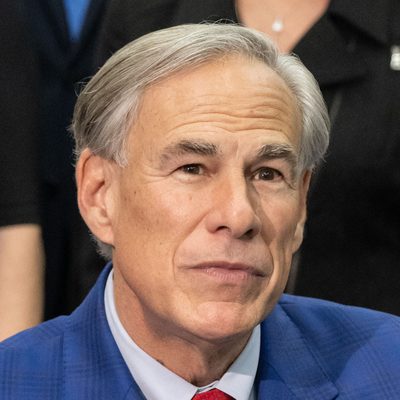
| 9 | Greg AbbottR Texas | 11,889,8423 races |
| 10 | George VoinovichR Ohio | 11,598,8345 races |
| 11 | Arlen SpecterR Pennsylvania | 11,234,3265 races |
| 12 | John W. BrickerR | 10,242,0557 races |
| 13 | Thomas E. DeweyR New York | 10,120,5944 races |
| 14 | Richard YatesR Illinois | 9,406,7088 races |
| 15 | Kay Bailey HutchisonR Texas | 9,344,9613 races |
| 16 | Ron DeSantisR Florida | 9,266,1315 races |
| 17 | Jim RhodesR Ohio | 8,927,3476 races |
| 18 | Connie MackR Florida | 8,725,3366 races |
| 19 | Everett M. DirksenR Illinois | 8,579,4854 races |
| 20 | Phil GrammR Texas | 8,441,3853 races |
| 21 | George DeukmejianR California | 8,386,6152 races |
| 22 | Jim ThompsonR Illinois | 8,332,0294 races |
| 23 | Richard G. LugarR Indiana | 8,137,8987 races |
| 24 | George BenderR Ohio | 7,915,0456 races |
| 25 | H. John Heinz IIIR Pennsylvania | 7,672,2685 races |









Vote share by office, election to election
Each chart is the Republican share of the recorded vote for that office, cycle by cycle, on one shared scale (raw totals climb with the population, so share is the comparable measure). Presidential coverage centers on the major and notable candidates, so presidential share tracks the two-party share closely; down-ballot coverage is more complete, and down-ballot cycles swing with which seats and states were on the ballot. The House and governor charts begin in 1900, where the year-by-year record is dense; every cycle is in the table below.
Compare Republican with the other parties in the Party Vote Tracker →
Show all cycles as a table (raw votes & share)
The most recent 24 cycles per office; figures are computed across the full span shown in each chart. Presidential rows link to that election’s results.
President 1856–2024
| Election | Republican votes | Share |
|---|---|---|
| 2024 | 77,302,580 | 50.0% |
| 2020 | 74,223,975 | 47.2% |
| 2016 | 62,984,828 | 46.5% |
| 2012 | 60,933,504 | 47.4% |
| 2008 | 59,948,323 | 45.9% |
| 2004 | 62,040,610 | 51.0% |
| 2000 | 50,456,002 | 48.4% |
| 1996 | 39,197,469 | 41.4% |
| 1992 | 39,104,550 | 37.7% |
| 1988 | 48,886,597 | 53.9% |
| 1984 | 54,455,472 | 59.2% |
| 1980 | 43,903,230 | 51.6% |
| 1976 | 39,148,634 | 48.9% |
| 1972 | 47,168,710 | 61.8% |
| 1968 | 31,710,470 | 43.7% |
| 1964 | 27,175,754 | 38.7% |
| 1960 | 34,107,646 | 49.9% |
| 1956 | 35,581,003 | 58.0% |
| 1952 | 34,075,529 | 55.5% |
| 1948 | 21,969,170 | 46.5% |
| 1944 | 22,006,278 | 46.2% |
| 1940 | 22,304,755 | 45.0% |
| 1936 | 16,681,862 | 37.5% |
| 1932 | 15,761,841 | 40.9% |
U.S. Senate 1914–2024
| Election | Republican votes | Share |
|---|---|---|
| 2024 | 54,409,180 | 48.0% |
| 2022 | 36,372,559 | 45.8% |
| 2020 | 39,884,185 | 49.2% |
| 2018 | 33,406,768 | 38.9% |
| 2016 | 41,127,637 | 42.7% |
| 2014 | 23,598,628 | 51.5% |
| 2012 | 38,764,551 | 41.7% |
| 2010 | 31,019,905 | 50.1% |
| 2008 | 29,502,131 | 44.6% |
| 2006 | 26,572,639 | 42.4% |
| 2004 | 39,920,562 | 46.3% |
| 2002 | 21,263,686 | 50.2% |
| 2000 | 34,000,842 | 44.2% |
| 1998 | 23,666,410 | 44.0% |
| 1996 | 24,211,395 | 49.4% |
| 1994 | 26,901,589 | 47.4% |
| 1992 | 29,141,318 | 41.1% |
| 1990 | 15,532,598 | 47.0% |
| 1988 | 29,464,693 | 43.7% |
| 1986 | 20,342,078 | 43.6% |
| 1984 | 22,850,493 | 50.3% |
| 1982 | 22,693,945 | 44.0% |
| 1980 | 26,814,392 | 45.4% |
| 1978 | 13,520,147 | 47.6% |
U.S. House 1823–2024
| Election | Republican votes | Share |
|---|---|---|
| 2024 | 73,993,503 | 50.1% |
| 2022 | 54,516,197 | 50.8% |
| 2020 | 71,793,710 | 47.0% |
| 2018 | 50,451,115 | 44.4% |
| 2016 | 61,609,373 | 48.0% |
| 2014 | 39,461,848 | 50.6% |
| 2012 | 57,004,463 | 47.0% |
| 2010 | 44,202,888 | 51.1% |
| 2008 | 51,140,683 | 42.4% |
| 2006 | 35,106,999 | 44.2% |
| 2004 | 55,153,998 | 49.4% |
| 2002 | 36,175,526 | 49.3% |
| 2000 | 46,317,371 | 47.6% |
| 1998 | 31,851,723 | 48.4% |
| 1996 | 40,805,476 | 46.6% |
| 1994 | 35,927,143 | 51.5% |
| 1992 | 43,010,103 | 44.8% |
| 1990 | 26,619,204 | 43.4% |
| 1988 | 36,292,085 | 44.4% |
| 1986 | 26,282,254 | 44.2% |
| 1984 | 38,156,376 | 46.3% |
| 1982 | 27,092,881 | 42.4% |
| 1980 | 36,180,979 | 46.5% |
| 1978 | 23,813,046 | 43.6% |
Governor 1824–2025
| Election | Republican votes | Share |
|---|---|---|
| 2025 | 2,867,291 | 42.5% |
| 2024 | 10,232,528 | 52.5% |
| 2023 | 1,593,517 | 53.9% |
| 2022 | 43,117,441 | 49.7% |
| 2021 | 2,918,343 | 49.8% |
| 2020 | 10,698,658 | 53.4% |
| 2019 | 1,898,436 | 50.0% |
| 2018 | 43,481,422 | 48.4% |
| 2017 | 2,075,314 | 44.3% |
| 2016 | 8,842,543 | 51.4% |
| 2015 | 1,497,713 | 53.4% |
| 2014 | 32,349,066 | 51.9% |
| 2013 | 2,292,286 | 53.1% |
| 2012 | 8,240,771 | 50.8% |
| 2011 | 1,512,124 | 58.5% |
| 2010 | 33,439,376 | 49.3% |
| 2009 | 2,338,096 | 53.3% |
| 2008 | 7,900,188 | 48.3% |
| 2007 | 1,566,252 | 57.5% |
| 2006 | 29,385,907 | 46.3% |
| 2005 | 1,897,598 | 45.7% |
| 2004 | 7,438,550 | 49.7% |
| 2003 | 1,743,172 | 51.7% |
| 2002 | 31,018,667 | 51.0% |
This page compiles the Republican Party's popular vote from our election database, counted at the level of individual races. We report each office on its own and never combine them into a single all-office total, because the same voter can appear in more than one race in a single year (a presidential year also carries Senate, House, and many governor contests). Figures cover general elections; coverage by office is shown below.
Counts are general elections in our data on the Republican ballot line, reported separately by office. We never combine offices into one total: a single voter can be counted in more than one race in a year. Year ranges are the earliest and latest such elections we record for each office; the U.S. Senate has no popular vote before 1914 (the 17th Amendment), and early House and governor labels follow the historical source and can predate the party’s modern founding.