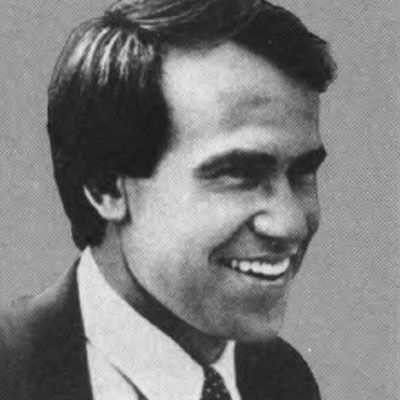
Jim Courter
★ U.S. Representative
- Born
- October 14, 1941
- Current age
- 84
- Home state
- New Jersey
- Party
- Republican
- Years in office
- 12 years in the U.S. House
- On the ballot
- 1978–1989
6-1
RecordWin–Loss
Total Popular Votes
Courter1.6M
Opponents1.8M
7
Elections run
Between 1978 and 1989, Jim Courter ran in 7 elections across 2 offices (U.S. House and Governor), winning 6 and losing 1. Courter's biggest single-election total was 838,553 votes, in the 1989 governor election in New Jersey. Courter's closest win came in the 1978 U.S. House election in New Jersey's District 13, decided by 5,493 votes.
Browse every governor election in New Jersey, every U.S. House race in New Jersey's District 12, or every U.S. House race in New Jersey's District 13.
How many votes has Jim Courter received?
Jim Courter has received 1,573,435 popular votes across 7 U.S. elections, with a career record of 6–1.
Election history
| Year | Office | Result | Votes | Opponent(s) |
|---|---|---|---|---|
| 1989 | GovernorNew Jersey | Lost | 838,55337.2% | James Florio |
| 1988 | U.S. HouseNew Jersey | Won | 165,91869.27% | Norman J. Weinstein Stephen Friedlander |
| 1986 | U.S. HouseNew Jersey | Won | 72,96663.49% | David B. Crabiel |
| 1984 | U.S. HouseNew Jersey | Won | 148,04264.98% | Peter Bearse Joseph R. Kerr III |
| 1982 | U.S. HouseNew Jersey | Won | 117,79366.76% | Jeff Connor Harold F. Leiendecker |
| 1980 | U.S. HouseNew Jersey | Won | 152,86271.64% | Dave Stickle John S. Schafer |
| 1978 | U.S. HouseNew Jersey | Won | 77,30151.84% | Helen S. Meyner |
Identity & sources. Identity verified against the Congressional Bioguide (C000809) and Wikidata (Q1621829). Election results come from official certified totals and the MIT Election Data and Science Lab; see methodology.
Cite this profile. PolitiFinder, “Jim Courter: election history & vote totals.” https://politifinder.com/p/jim-courter. Accessed [date].